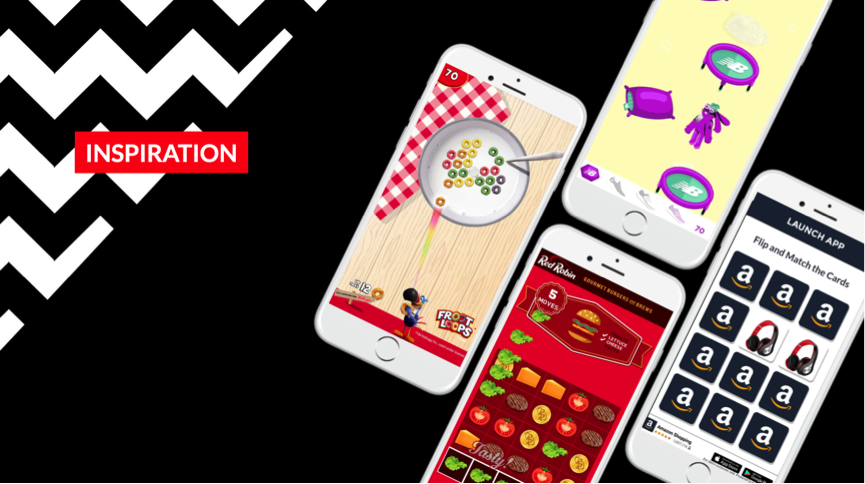
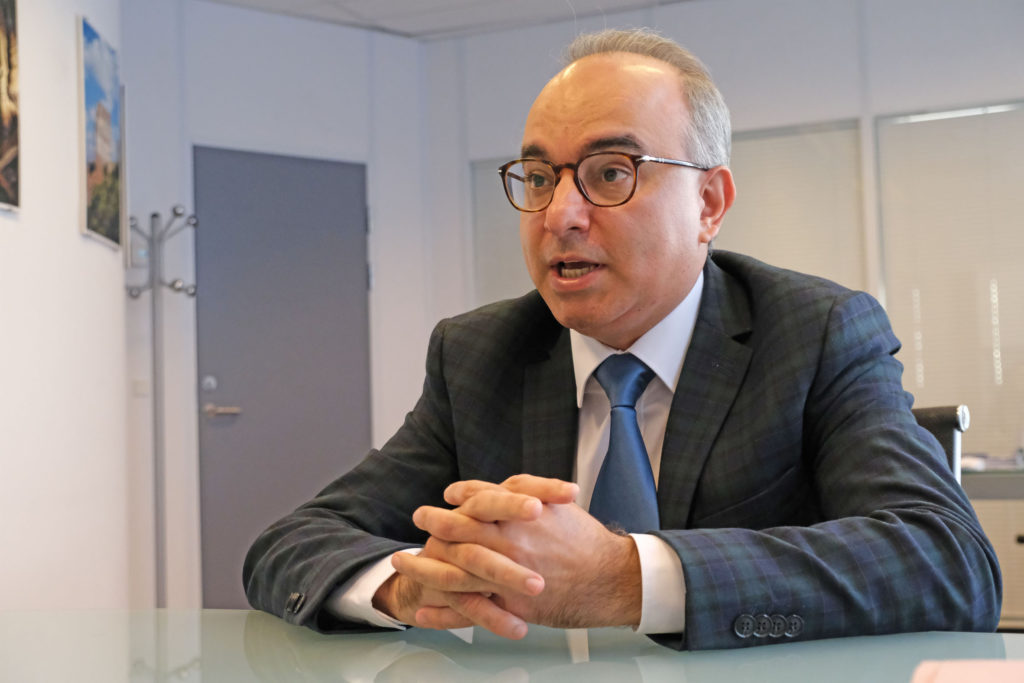
Skip to content
  • Homepage
  • Work
  • About
  • Capabilities
  • Views
  • Global
    • Gibraltar
    • Malta
Menu
  • Homepage
  • Work
  • About
  • Capabilities
  • Views
  • Global
    • Gibraltar
    • Malta
Contact
  • HOME
  • Work
  • About
  • Capabilities
  • Views
  • Contact
  • Global
    • Gibraltar
    • Malta
Menu
  • HOME
  • Work
  • About
  • Capabilities
  • Views
  • Contact
  • Global
    • Gibraltar
    • Malta

Visualising Huge Numbers

Severino Ribecca

  • April 23, 2015
  • , Content Creation
Content Creation
data visualisationinfographicsinteractive infographics
April 23, 2015
Severino Ribecca

Visualising Huge Numbers

Being so abstract, numbers can quickly vary from being very incomprehensibly large, to minuscule and often it can be difficult to visualise them or to conceptualise what they mean.

With small amounts, for example five apples, we can visualise in our mind’s eye what that will look like from our experience of apples. But try to imagine one BILLION apples and our mind loses track. The problem is the human mind is only quick at counting in small numbers and we need a point of reference from memory to conceptualise how big larger numbers are. So for example, if you know that a standard crate of apples contains 30 apples, then you visualise that 90 apples is 3 apple crates.

visualising huge numbers
Source: Joules of the Universe- Absolute Motion Institute

Using your imagination for visualising huge numbers is great, but you still have to communicate your concepts of scale verbally. You’re converting from the images in your mind into sound, which is then converted back again into  images in the mind of another person. Why not communicate straight into visuals from the start?

Below are examples of effective ways designers and film makers that have used visual communication to explain huge numbers. We’ll also look through types of data visualisations that have been used to successfully explain huge numbers or have just used huge numbers to create magnificent pieces of art.

Powers of Ten Film (1977)

Produced by Charles & Ray Eames, this documentary film depicts the relative scale of the Universe according to each order of magnitude. The film starts off in a picnic scene before zooming out off into deep space and then back again, zooming into the subatomic world. By sequentially giving context to the scale of things at each size allowed viewers to relate how big (or small) an object was by comparing it visually to the objects that came before it – giving the viewers some perspective. The Powers of Ten film also illustrates how minuscule we are on the cosmic scale.

[youtube http://www.youtube.com/watch?v=0fKBhvDjuy0?rel=0]

The Scale of the Universe 2

Taking inspiration from the Eames brothers’ film, Cary & Michael Huang created their version of the Powers of Ten film in the form of an interactive piece: The Scale of the Universe. Using a slider you can control your journey through each magnitude of scale.

visualising huge numbers

The MegaPenny Project

A website that uses a US penny as a point of reference to visualise huge numbers.  The website starts off at a single penny and finishes off displaying the size visually of one quintillion pennies.  Each significant increase in the amount of pennies is broken up into stages, along with other visual references to help provide perspective to the user how big these quantities are.  Along with showing the amount of space these quantities of coins take up, The MegaPenny Project also helps visualise large amounts of money.

visualising huge numbersThe Art of Pi (π), Phi (ϕ) and e

This series of beautiful data art was created by two Canadian scientists Christian Ilies Vasile and Martin Kryzwinski.  By utilising the software Circos, they managed to create colourful visual representations of the mathematical constants of π (pi), φ (phi) and e.  All done through using transition probabilities and colour-coded digits on Archimedean spirals.

visualising huge numbers
Progression of the first 10,000 digits of Pi
visualising huge numbers
Progression and transition for the first 1,000 digits of Phi
visualising huge numbers
Progression and transition for the first 2,000 digits of Pi, Phi and e

Information is Beautiful: Big Numbers

David McCandless’ website has its own section on visualising huge numbers.  Most of the charts on display are treemaps, bubble charts and proportional area charts.  However, one particular piece that stood out for me, was “Debtris” an animated version of a treemap, presented like the Tetris video game. This animation helped make the stats engaging by making it entertaining. It’s also a clever, alternative way of presenting a treemap.

[youtube http://www.youtube.com/watch?v=qqOJTwI3oVQ?rel=0&w=640&h=360]

RECENT POSTS

Gibraltar Uncovered- In the Hot Seat with The Hon Minister Vijay Daryanani.

A lunch hour with The Hon Minister Albert Isola – Minister of Digital, Financial Services and Public Utilities

Live Streaming and Covid- The Perfect Storm ?

Uncovering Gibraltar’s Digital Movers and Shakers

Influencer Marketing . How To Get It Right 🙌🏼

A Better Way. Our Purpose. Beyond 2020 and ‘The New Normal’.

SEARCH

LATEST WORK

SUBSCRIBE TO VISU.AL

loader

RECENT POSTS

READ MORE HERE

LATEST VIEWS & NEWS

vijay daryanani visualagency gibraltar

Gibraltar Uncovered- In the Hot Seat with The Hon Minister Vijay Daryanani.

visualagency

A lunch hour with The Hon Minister Albert Isola – Minister of Digital, Financial Services and Public Utilities

live streaming visualagency

Live Streaming and Covid- The Perfect Storm ?

All articles loaded
No more articles to load

Share this post

Share on facebook
Share on google
Share on twitter
Share on linkedin
Share on pinterest
Share on print
Share on email
PrevPreviousSocial intelligence – New insight for business success
NextStarwatch: Hubble and Webb – The past, present and future (Infographic)Next

GET VISU.AL NEWS AND EXCLUSIVES

SIGN UP TO OUR NEWSLETTER

loader

WHERE WE ARE

LONDON
61 PHILPOT STREET, LONDON, E1 2JH
GIBRALTAR
@WORKLAB,
WESTONE, EUROPORT ROAD, GIBRALTAR,
GX11 1AA

GET IN TOUCH

+44(0) 20 7618 6101

NAVIGATE

HOME

WORK

ABOUT

CAPABILITIES

VIEWS

CONTACT

INTERACT

  • FACEBOOK
  • TWITTER
  • INSTAGRAM
  • LINKEDIN
  • VIMEO
  •      FLIXEL

WHERE WE ARE

LONDON
61 PHILPOT STREET LONDON, E1 2JH
GIBRALTAR
@WORKLAB,
WESTONE, EUROPORT ROAD, GIBRALTAR,
GX11 1AA

GET IN TOUCH

+44(0) 20 7618 6101

NAVIGATE

HOME

WORK

ABOUT

CAPABILITIES

VIEWS

CONTACT

INTERACT

  • FACEBOOK
  • TWITTER
  • INSTAGRAM
  • LINKEDIN
  • VIMEO
  •      FLIXEL

Copyright © 2020 VISU.AL | Privacy Policy | Terms & Conditions